
User Guide to the ShipHero Web Dashboard Reports Menu
This article explains the Reports menu in the ShipHero Web Dashboard.
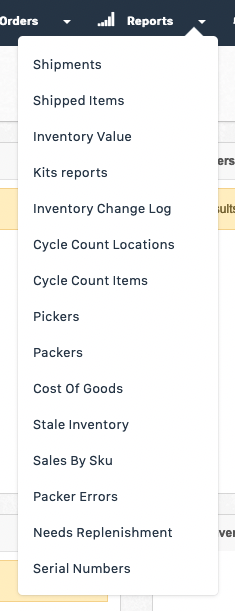
Shipments
Use this report to measure the volume of shipments made within ShipHero. See the number of shipments made in a specific time period, your shipment cost, your end-customers’ shipment costs, profit, and items shipped. There are multiple ways to filter the report, such as by date, carrier, shipping label status, store, and warehouse.
The Column Visibility tab allows control over which fields you view on the page. You have the option to export the data to CSV or PDF.
Shipped Items
View all products shipped within a certain timeframe and which orders they are associated with.
The Column Visibility tab allows control over which fields you view on the page. You have the option to export the data to CSV or PDF.
Inventory Value
Use this report to calculate your current or historical inventory value. Filter by date, warehouse, and vendor. See the total inventory value within a specific timeframe as well as the value on an individual line item level.
The Column Visibility tab allows control over which fields you view on the page. You have the option to export the data to CSV or PDF.
Kits Reports
View all kits. Filter by kit SKU, warehouse, component SKU, component Name, quantity, and date Created.
The Column Visibility tab allows control over which fields you view on the page. You have the option to export the data to CSV or PDF.
Inventory Variance
Note: Applies only to Static Slotting accounts.
When cycle counting, if there are any changes made to inventory, they will be recorded in this report. Filter by date to view a specific time period.
The Column Visibility tab allows control over which fields you view on the page. You have the option to export the data to CSV or PDF.
Inventory Change Log
Whether inventory is updated manually or because more product was received on a purchase order or inventory was deducted because orders shipped out, you can check all inventory adjustments here. Filter by date and warehouse.
The Column Visibility tab allows control over which fields you view on the page. You have the option to export the data to CSV or PDF.
Cycle Count Locations
The Cycle Count Locations Report shows all location information recorded during cycle counting. At the top of the report, you may use filters to select the specific data you are interested in viewing.
Cycle Count Items
The Cycle Count Items Report shows all item information recorded during cycle counting.
Pickers
View individual picker statistics using the Picker Report. Select the date you want to view and see the number of items picked versus the number of unique items picked for the selected date. This report also calculates the overall statistics for the specific picker. Directly reference the order number each item was picked for, the product that was picked, and which tote was used for the order.
The Column Visibility tab allows control over which fields you view on the page. You have the option to export the data to CSV or PDF.
Packers
View individual packer statistics using the Packer Report. Select the date you want to view and see the number of labels printed, items packed, unique item packed, whether or not product barcodes were scanned at packing, and if any packing errors were made.
For static slotting accounts, you can also view the number of SKUs cycle counted and individual products that were counted.
Cost of Goods
The COGS report is most commonly used for determining sales taxes due for a specific time period. Filter by Store and use the Column Visibility Tab to determine which columns you want to export to CSV or PDF. Profitability factors include:
- Selling price on individual orders
- Value: Current cost of the product
- Shipping amount paid by the customer
- Actual shipping cost for you
- Return total sales and taxable sales
Stale Inventory
Determine how long it will take to sell out current products and how many have been sold within the last 90 days or over the last year. Use this report to calculate which products you should purchase less of in the future.
The Column Visibility tab allows control over which fields you view on the page. You have the option to export the data to CSV or PDF.
Sales by SKU
View inventory sales, filter by Vendor, Store, and whether or not the products are Active. If you have stock at Fulfilled by Amazon (FBA), you can view the same information for FBA products in this report. By default, sales velocity is based on the date period of 365 days to 335 days ago. Customize the report sales period in your General Settings.
To refresh daily data, click the here button at the top of the report.
The Column Visibility tab allows control over which fields you view on the page. You have the option to export the data to CSV or PDF.
Packer Errors
Review reported packer errors in one place. Sort by date and packer name. See the date the error was recorded, who the packer was that made the mistake, what the error was, which product SKU was affected and the order number that resulted in an error.
To report an error, find the original order using the search bar on the Manage Order page, open the order and scroll to the 'Shipment' section on the right side of the screen. Click 'Report' to select the associated product and record the issue.
The Column Visibility tab allows control over which fields you view on the page. You have the option to export the data to CSV or PDF.
Needs Replenishment
The Needs Replenishment Report is designed to help you keep track of which products need to have their picking bins replenished.
Note: This applies only to accounts with Dynamic Slotting.
Serial Numbers
View this report if your products require serial numbers. See which serial numbers were used on which orders. Sort by date, Store, and Warehouse.
On the product level, indicate which products require a serial number by enabling the product detail "Needs serial number." This can be initiated on the individual product page or through Bulk Edit. When you go to pack an order with a product that requires a serial number, once the product barcode is scanned to be packed, you will be prompted to scan or type in the serial number. After the label is generated and the order is completed, the serial number and order will appear in this report.
The Column Visibility tab allows control over which fields you view on the page. You have the option to export the data to CSV or PDF.